If you have enabled a PostScript viewer in your browser
(for example by registering ghostview %s (Unix)
or GSView %s (Windows) with your browser as
the application for handling PostScript files),
you can click on
 to see an image of higher quality, and on
 to see the file that produced it.
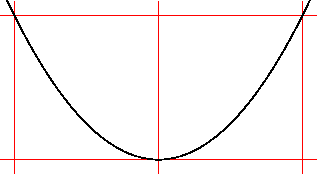
We want to add to this a few labels to produce this:
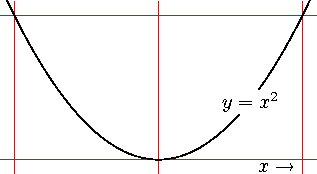
The point is that the labels ought to be in  ,
as they are here.
,
as they are here.
We shall offer three ways to solve this problem. They differ in their answer to the questions: Where does text end and graphics begin? To what extent should one expect to poke around inside a graphics file? How much work is a well designed label in a figure worth?
- Overlaying the graphics file
with
- Advantages: It works with any conceivable graphics format. It guarantees that changes of fonts in the text itself will automatically lead to changes in the labels.
- Disadvantages: Changes of size in the text are necessarily propagated to the labels. You have to move both files around together, and if you make changes in one you have to remember to make corresponding changes in the other.
- Making changes directly inside the original
graphics file
- Advantages: It is very efficient, and gives the most control.
- Disadvantages: You won't want to do this unless you know how to read and program in PostScript.
- Importing
the figure file and PostScript label files into a single larger file
- Advantages: Gives a reasonable amount of control over how the labels are embedded into the figure. The same technique applies to merge any two one-page PostScript figures into one.
- Disadvantages: Produces somewhat bloated files. Probably involves some PostScript programming to embed the labels correctly into the figure. Requires more (but simpler) text-handling than the others.
Written by Bill Casselman with help from David Austin and Joel Feldman.